Using Steam reviews to
estimate player numbers
- an intuitive method
Are Steam reviews a precise indicator of player numbers or rough rule of thumb?
Key Insights
- Number of reviews strongly correlates with number of players.
- Release date, price and review score can help refine player predictions.
- In 2019 changes made within Steam led to a 240% increase in daily reviews, impacting the number of players per review.
- Most games on Steam have a low number of players and reviews – very small games can be harder to predict.
Would you like a quick, accurate way to understand the games market on Steam? We’ve put together a useful method to help you do just that.
To estimate the number of people playing Steam games you typically start by looking at the number of reviews. However, without an understanding of the ratio between players and reviews you can end up with poor estimates.
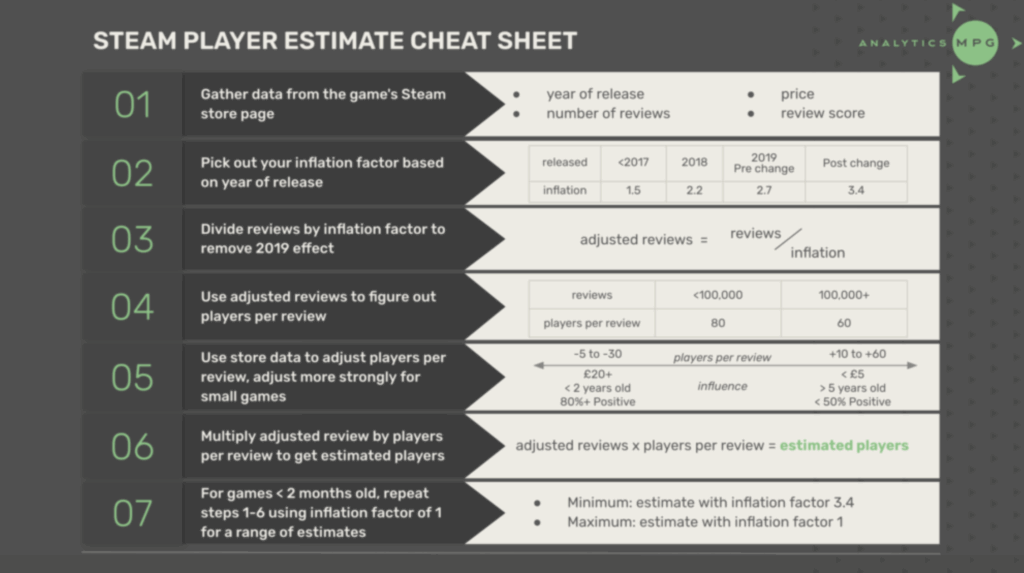
To help develop your intuition for estimating player numbers, we’ll outline a method in this article that you can use to make quick and easy estimates, backed up by exploratory analysis and results from regression modelling. We’ll present this upfront in a neat cheat sheet and go into detail further on.
Steam Player Estimate Cheat Sheet
Follow these 7 steps to get an accurate picture of player numbers for most games.
Existing Methods

Figure 1: SteamDB estimates for Hunt: Showdown and Elden Ring.
Figure 1 shows two examples of games and their player estimates taken from SteamDB. “On reviews” is based on the number of reviews and release year, whereas SteamSpy’s method is based on data from user profiles. Both provide a very wide range, especially for large games like Elden Ring – in comparison, using complex methods PlayTracker narrowed the range greatly to give a more useful estimate, but only PlayTracker knows how this works.
Our method aims to be easy to understand and use, and will provide you with accurate results. This method will predict most games within a reasonable margin and help to understand a game’s size, but should not be relied on for any complex analysis. The aim is to develop your intuition for game numbers – for more precise numbers, we use a prediction model with more features, discussed briefly later in the article.
Analysis
For our analysis we use the well-known 2018 dataset of Steam player estimates, created using an estimation method based on high precision achievements data that was previously available from the Steam API. We refer to players rather than sales, as this is the measure the achievement method was estimating. The ratio between players and copies sold can vary a lot – how many games are sitting in your Steam library that you haven’t played? Consider this when comparing estimates to numbers reported by developers, who typically report copies sold rather than players.
Reviews to Players Ratio
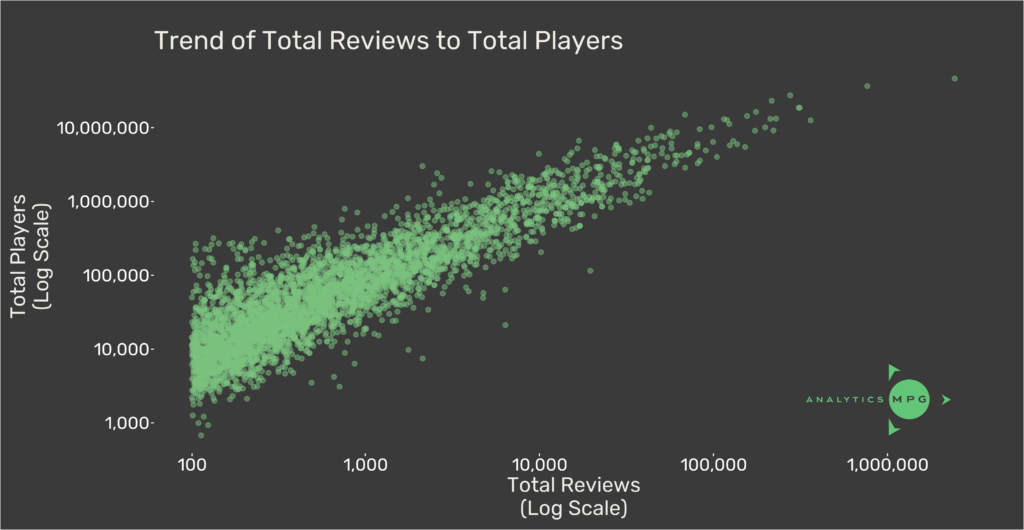
Figure 2: Scatterplot of total reviews against total players, with a log scale for both axes. Player numbers from 2018 dataset, reviews numbers from Steam API.
Reviews are useful for estimating players because of the strong correlation between the two values. In this 2018 dataset there is a 0.78 correlation between number of reviews and players – clearly a strong trend, but there is also much variation to be explained. Figure 3 shows the distribution of the players per review (players / reviews):
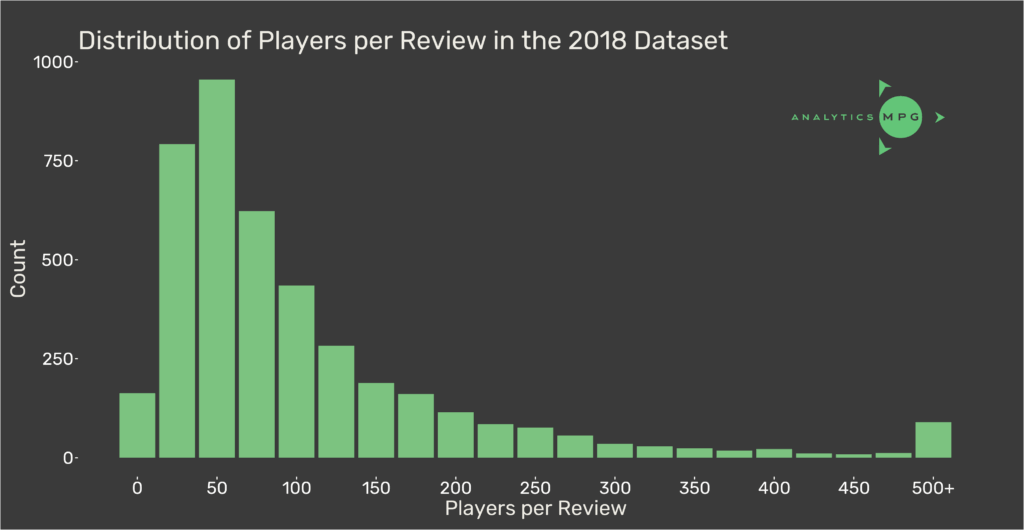
Figure 3: Histogram of players to reviews ratio for games over 100 reviews.
The median game in this data has 81 players per review and we can see the majority of games have fewer than 150 players per review, although there are also outliers with much higher ratios.
The 2019 Reviews Change
In October 2019 Steam started prompting players to review games after a certain amount of playtime, officially reporting that this led to a 300% increase in daily reviews. Figure 4 shows a rolling 30 day average of reviews since 2018:
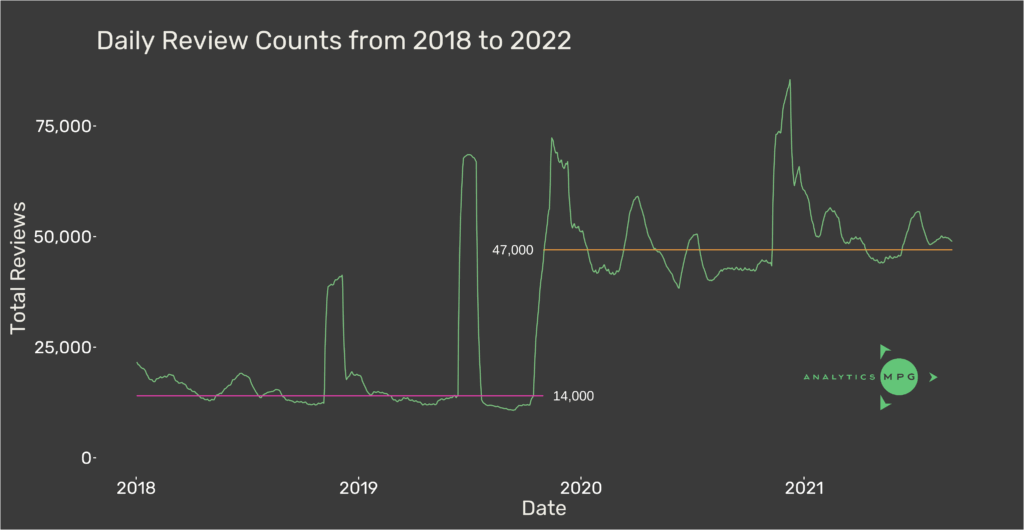
Figure 4: Total Steam reviews across all games between 2018 and 2022.
There is a clear spike after the change – comparing the medians before and after (pink and orange lines) we see the median increased by a factor of 3.4 (240% increase). Consequently, reviews left after this change are worth less than those before the change when considering the players per review.
Games released before Oct 2019 will have some reviews left before the change and some left after. If we downweight those left after by a factor of 3.4, and then compare the total reviews to the true number observed, we can work out overall how much each game was affected by the change. Figure 5 shows the trend of this based on release date:
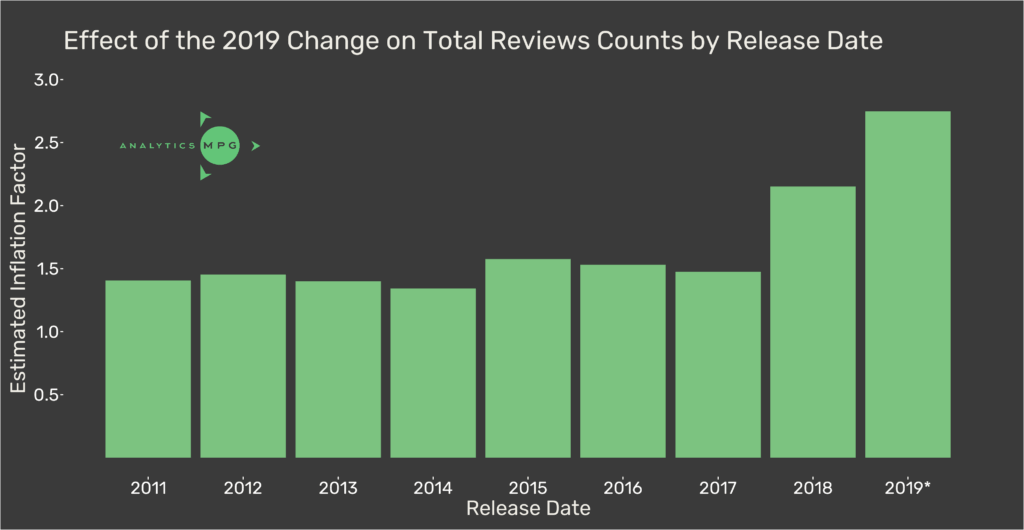
Figure 5: Impact of the Oct 2019 reviews change on games released before the change. 2019* only includes releases up to 31/10/19.
The reviews change seems to inflate 2018-19 releases more significantly than those released earlier. This is summarised in Table 1:
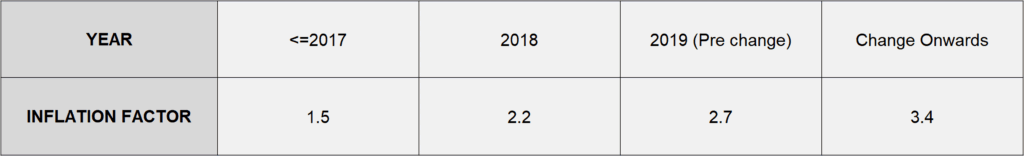
Table 1: Inflation factor by year.
To estimate the number of reviews had the change not happened, we simply divide number of reviews by the inflation factor.
Adjusted Reviews = Reviews ÷ Inflation Factor
One caveat is that after the 2019 change, players are prompted to review after a certain amount of playtime. This means that for very recently released games, fewer players will have played enough to receive the prompt. For the same reason, we have observed the method under-predicting for games with large spikes in reviews around release. We’ll conduct further research in the future to dig further into this to improve the method, but for now we recommend that if a game is less than 2 months old, try with inflation factor and try without, and this will give you a range of estimates that will likely include the true value.
Building a Basic Prediction Model – Other Factors
After adjusting for inflation we can look at data from game store pages, and apply results from the 2018 data. We will focus on 4 key factors:
Number of reviews
Release date
Price
Review score
See Figures 6 and 7 for examples of these on the Steam store:
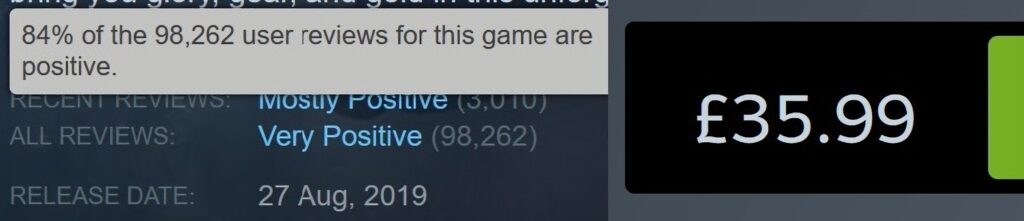
Figure 6: Steam Store features for Hunt: Showdown. Review score, amount of reviews, release date and full price.
Figure 7: Detailed view of review counts, showing the true total for both Steam and non-Steam purchases.
The top of the store page shows 100,000 reviews, but scrolling down to the detailed reviews section we can see the true total is 133,000. This is because by default Steam only shows the number of reviews left by users who purchased the game directly through Steam, excluding those who bought keys through services such as Humble Bundle. Our analysis uses this total reviews number.
The release date in Figure 6 also says Aug 2019, however Figure 7 shows that there are reviews dating back to Feb 2018. Make sure to check the graph to get the true release date – there are many games with early access periods. If the early access period was especially long or the game officially released very recently then checking this will help you get more accurate estimates. Figure 5 used early access release date when calculating the inflation factor.
Figures 8-11 show the trends of players per review for each of the 4 store features:
Game Age
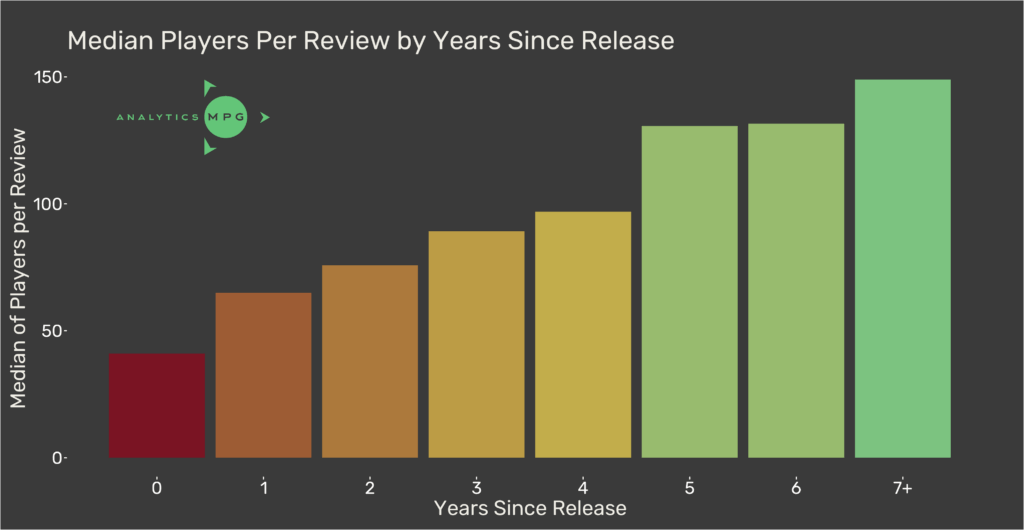
Figure 8: Median players per review for games based on years since release.
Price on Release
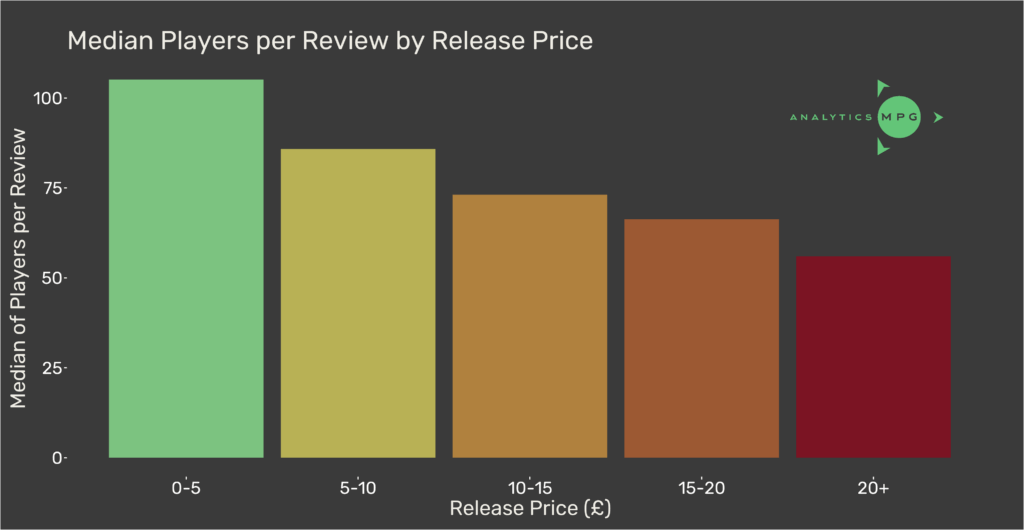
Figure 9: Players to reviews ratio for different release prices of games.
Average Review Score
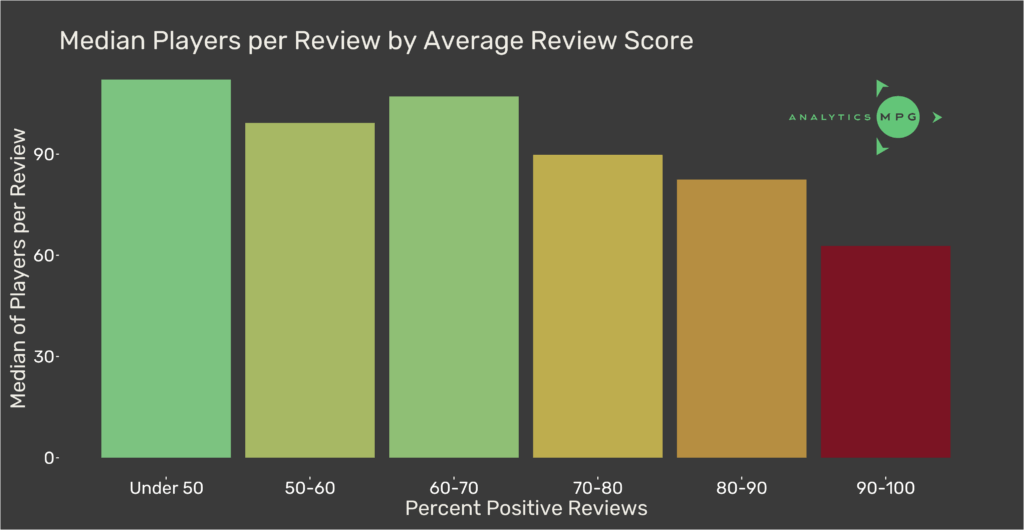
Figure 10: Players to reviews ratio for different average review scores of games.
Total Number of Reviews
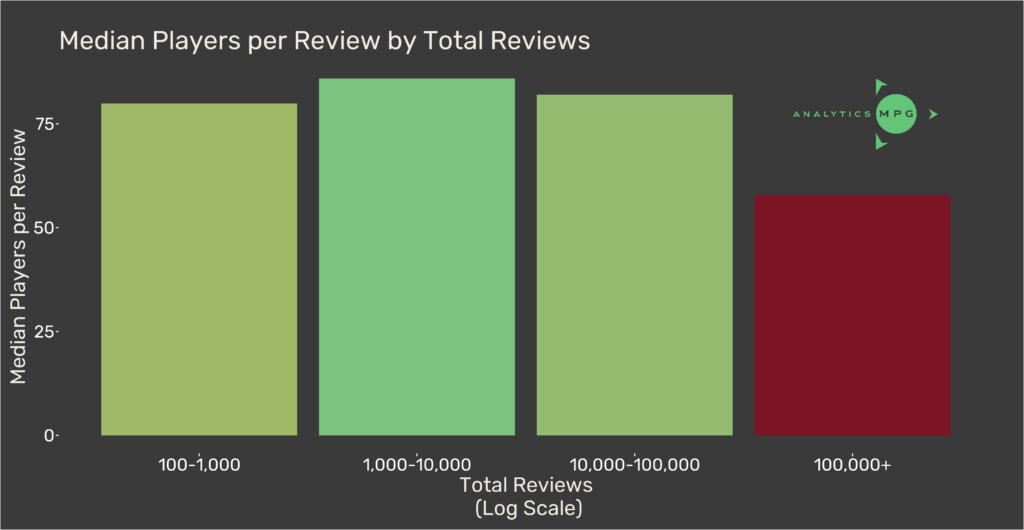
Figure 11: Players to reviews ratio for different amounts of reviews.
The trends we see are:
The older a game is, the less likely someone is to leave a review
The more money someone has invested into a game, the more likely they are to leave a review
The more people enjoy a game, the more likely they are to leave a review
People are slightly more likely to leave a review for really popular games
How can we aggregate this information to make player estimates?
Weighing the Factors
To help understand which features are important for estimating players per review, we created a regression model using XGBoost. As a decision tree based algorithm, it handles redundant features and collinearity exceptionally well, and in particular, upon training generates the relative importance of each feature in making its predictions. See Figure 12:
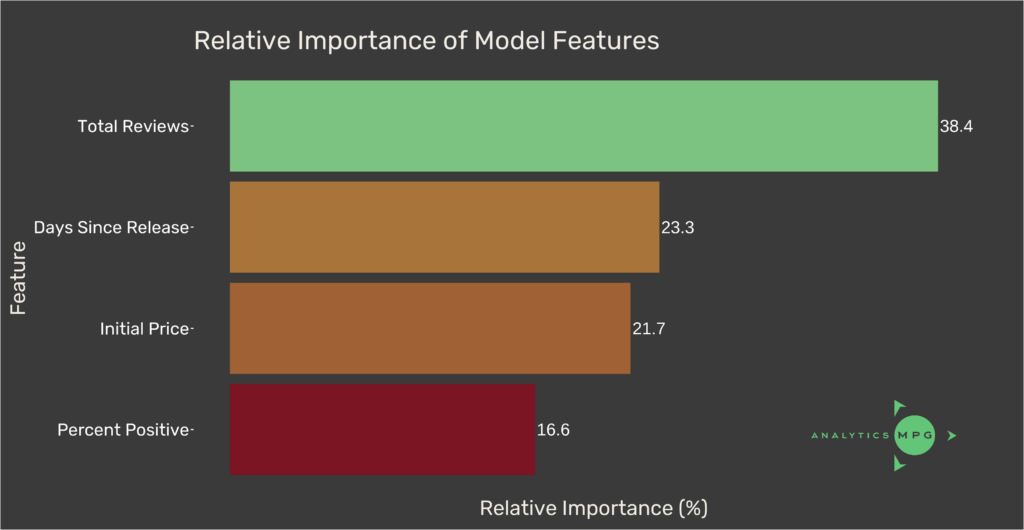
Figure 12: Feature importance of the four variables in an XGBoost regression model.
Total reviews is the highest weighted feature, with the other three being less significant (but still providing some unique information to the model). Therefore we suggest picking players per review based on total reviews and then using the other three features to make adjustments.
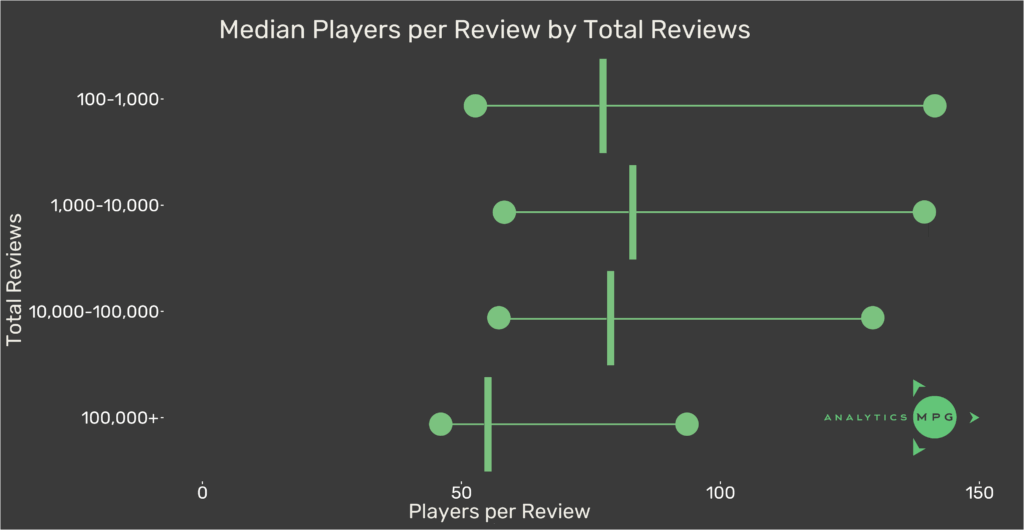
Figure 13: Median players per review for different amounts of reviews, denoted by the vertical lines. The ranges around each median show the interquartile range, where 50% of values lie.
Figure 13 shows the range around the median players per review for different amounts of reviews. The range is closer for bigger games – there is more variance in the players per review ratio for smaller games. For games under 100,000 reviews, we would start at 80 players per review and adjust to somewhere between 50 and 140, going even further in extreme cases. For games over 100,000 reviews we would start at 60 and adjust to between 45 and 90.
The Method:
Here we outline the final method for estimating players:
First divide total reviews by 1.5 – 3.4 based on release year to remove the inflation from the 2019 change.
Choose 80 players per review for games under 100,000 adjusted reviews, and 60 for games over 100,000.
Increase players per review for older, cheaper and negatively received games. Decrease it for newer, more expensive and positively received games. The smaller the game, the more significant an adjustment you should make.
Finally, multiply your adjusted reviews by this estimated players per review to get your players estimate.
If the game is under 2 months old, repeat with inflation factor of 1 and compare to the estimate with inflation factor of 3.4, giving you a range of estimates.
Hunt: Showdown – A Worked Example:
We will estimate the players for Hunt: Showdown as a worked example (see Figures 6-7 for the features):
Take the reviews total of 133,756 and divide by inflation factor 2.2, as it was released in 2018. This gives an adjusted reviews of 60,798.
Choose 80 players per review, as this is now under 100,000 reviews.
Game is not very old or very new, so ignore the age feature.
Expensive and has a decent review score, so we reduce players per review.
Given the size of the game we might adjust to -30 or higher, but because the game is not extremely expensive or positively rated, we’ll just do a small adjustment of -10.
We pick 70 players per review, multiply this by adjusted reviews of 60,798 and estimate just over 4 million players.
The game reported 3 million players across all platforms in Feb 2021 (including Xbox and PlayStation, though these make up a small percentage of Hunt: Showdown’s players) so this Steam estimate for April 2022 might be over-predicting slightly, but is not far off.
Model Results:
To improve precision, we can add complexity to our regression model through the use of additional features, such as playtime of review author and variance in review counts. Predictions for Hunt: Showdown as of 01/01/2022 for the simple four feature model and the more complex model are 2,682,800 and 2,539,500 respectively. In future work we will discuss more of the details of this complex model.
Summary:
The total reviews count appears to capture general enthusiasm for a game, and is a strong place to start when predicting players. We suggest first adjusting for the 2019 change, and then making an initial estimate around total reviews before adjusting based on the other 3 features. Following these steps for a particular game, you can get a players estimate that will be fairly close to those made with a much more complex model and in particular, insight into its level of success.
Try it yourself:
Here are some games on Steam along with their store features – using the method we have outlined, how many players do you think they might have?
Back 4 Blood: 38,016 reviews, released 2021, £49.99 release price, 64% reviews positive
Enter the Gungeon: 67,237 reviews, released 2016, £10.99 release price, 96% reviews positive
War Thunder: 315,356 reviews, released 2013, Free to Play, 78% reviews positive
Sniper Elite: Nazi Zombie Army: 4,277 reviews, released 2013, £10.99 release price, 88% reviews positive
Slime Rancher: 92,721 reviews, released 2016, £14.99 release price, 97% reviews positive
Planet Zoo: 56,782 reviews, released 2019 (post change), £34.99 release price, 89% reviews positive
Return of the Obra Dinn: 17,159 reviews, released 2018, £15.49 release price, 96% reviews positive